
-
Brand Sensing
Pink Diamonds
New Coke
Brand
Positioning
Brand Image Tracking
Image Profiling
Perceptual Maps
Thums Up
Brand Health
- Brand Sensing
- Brand Equity
- Marketing Education
- Is Marketing Education Fluffy and Weak?
- How to Choose the Right Marketing Simulator
- Self-Learners: Experiential Learning to Adapt to the New Age of Marketing
- Negotiation Skills Training for Retailers, Marketers, Trade Marketers and Category Managers
- Simulators becoming essential Training Platforms
- What they SHOULD TEACH at Business Schools
- Experiential Learning through Marketing Simulators
-
MarketingMind
Brand Sensing
Pink Diamonds
New Coke
Brand
Positioning
Brand Image Tracking
Image Profiling
Perceptual Maps
Thums Up
Brand Health
- Brand Sensing
- Brand Equity
- Marketing Education
- Is Marketing Education Fluffy and Weak?
- How to Choose the Right Marketing Simulator
- Self-Learners: Experiential Learning to Adapt to the New Age of Marketing
- Negotiation Skills Training for Retailers, Marketers, Trade Marketers and Category Managers
- Simulators becoming essential Training Platforms
- What they SHOULD TEACH at Business Schools
- Experiential Learning through Marketing Simulators
Perceptual Maps (Correspondence Analysis)
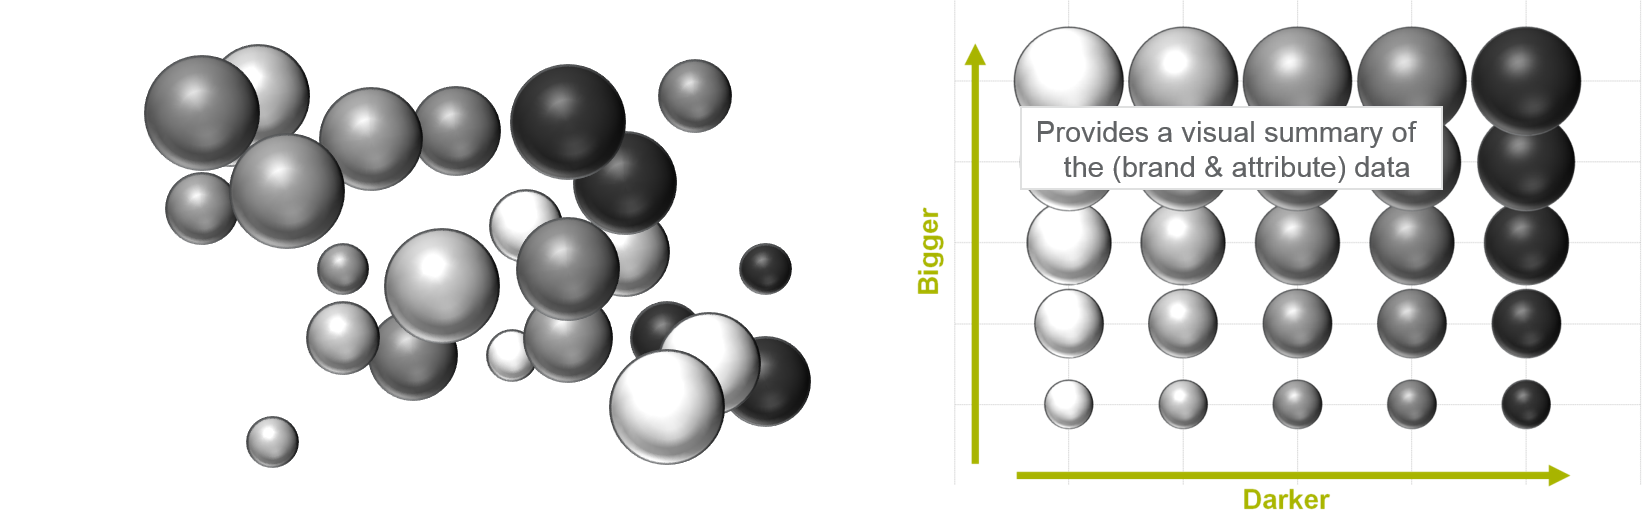
Exhibit 1.12 A set of bubbles that differ in terms of size and shade, depicted along those two dimensions.
In layman terms, correspondence analysis is the depiction of some entities in a two or more dimensional perceptual map that reflects the similarities and differences between the entities. Consider for instance the set of bubbles shown on the left of Exhibit 1.12. These bubbles, which differ in size and shade, are represented on a two-dimensional map so that bubbles that are similar are placed next to one another, and those that differ are further apart.
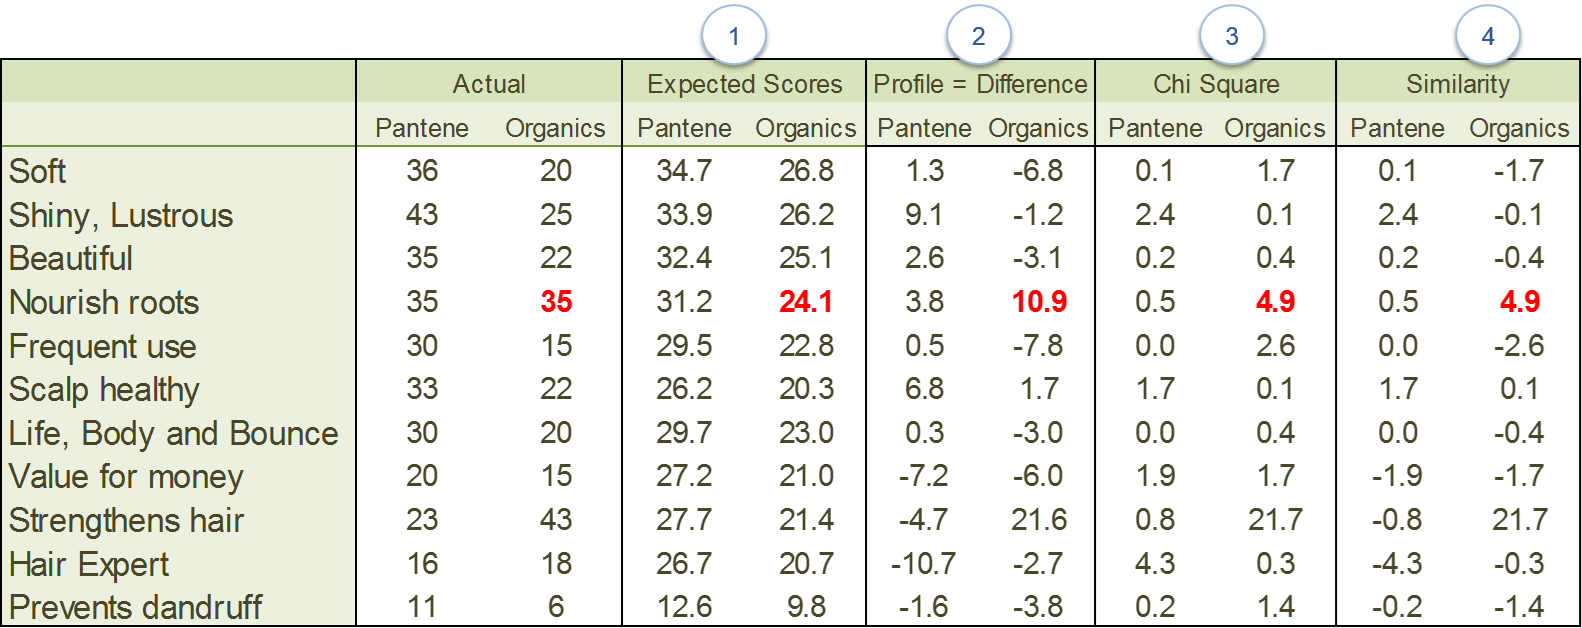
Similarly, by employing statistical techniques like correspondence analysis, the brands and their image attributes can also be vividly depicted on a multidimensional perceptual map. Statistical packages like SPSS and SAS are used to craft perceptual maps of brands based on their image profile. The approach is summed up in the following steps:
- Compute Expected Rating. (Same method as for image profiling)
- Image Profile = Actual Rating − Expected Ratings
- Standardize the difference across cells. (Chi-square values)
Chi-square value =(Profile)² / Expected Rating
- Compute Similarity by applying the sign of the Profile to the chi-square values. These values provide a standardized measure of association.
- Use correspondence analysis (CA) to create the perceptual map. CA reduces the numerous
attributes that measure different attitudes and perceptions, to a few
independent factors that sum up the attributes. These factors become the
dimensions for the perceptual map. The attributes and brands are then
represented on the multidimensional space in a manner that visually
depicts their similarities and differences.
Note: In SPSS, Correspondence analysis falls under ‘Dimension Reduction’ (Analyse > Dimension Reduction > Correspondence Analysis ...).
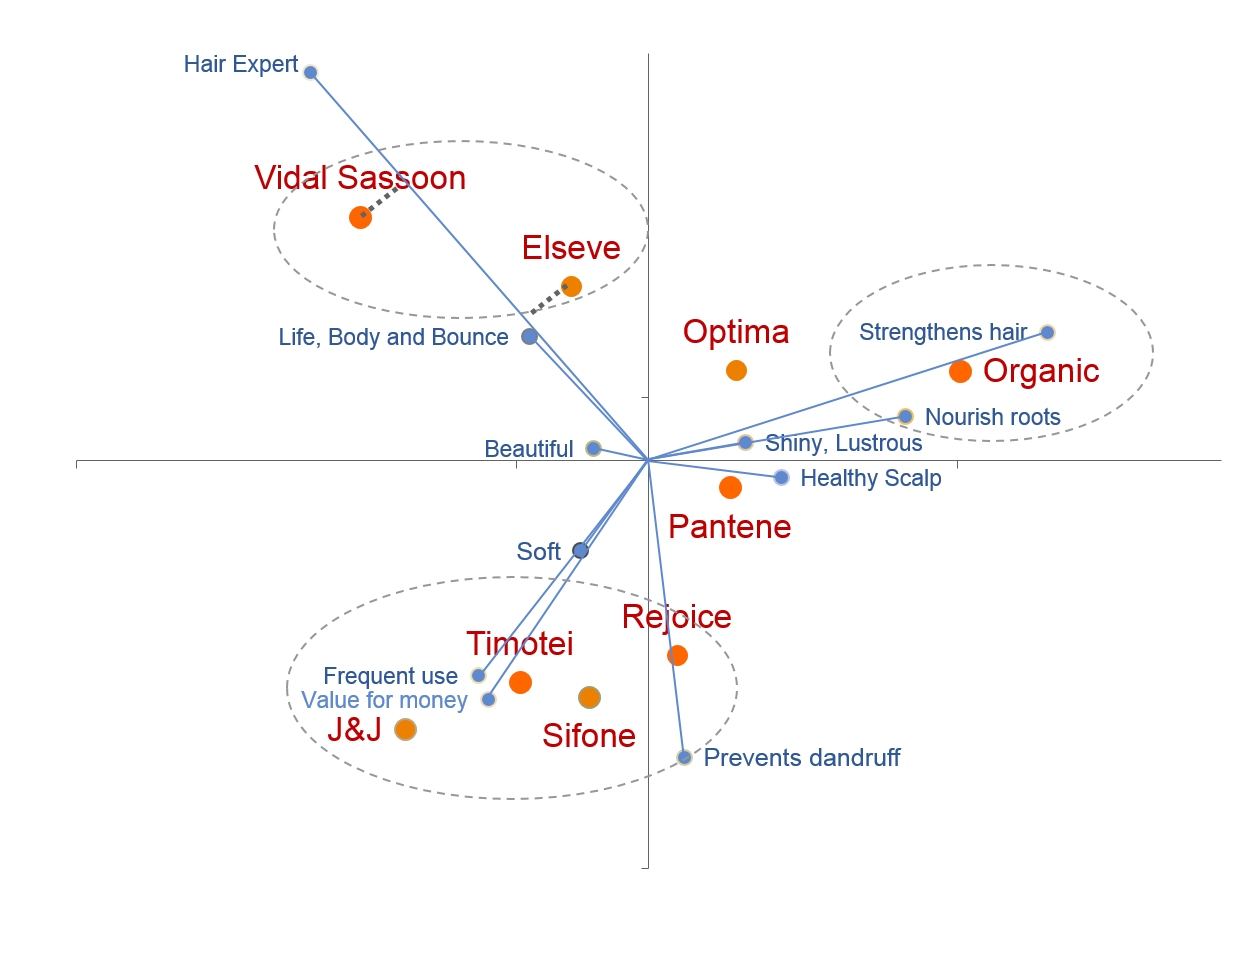
These steps are outlined in Exhibit 1.13 for Organics and Pantene, and the resulting perceptual map is shown in Exhibit 1.14.
The following are guidelines on how to interpret perceptual maps:
- The attributes and products on the perceptual map are vectors. The line from the origin to an attribute or a product represents the direction and magnitude of the vector.
- The closer the products are on the map, the more similar they are perceived to be.
- The longer an attribute’s line, i.e., the longer the vector, the greater is the importance of that attribute in differentiating the products in the market.
- To assess the strength of a brand’s position on any attribute,
draw an imaginary perpendicular line from the product to the line representing
the attribute. The farther an offering is from the origin along the direction
of that attribute, the higher is the rating of the offering on that attribute.
Refer, for instance, to the dotted line in Exhibit 1.14, drawn from Vidal Sassoon to form a perpendicular with the vector Hair Expert. Since the line from Vidal Sassoon intersects the attribute vector at a further distance, we can tell that Vidal Sassoon is positioned more strongly on this attribute than Elseve. Notice too that all brands other than Vidal Sassoon and Elseve, would intersect on the negative side of the vector. Compared to other attributes, on an average the association of these brands with the attribute Hair Expert is relatively weak.
With regard to the shampoo data, the following are some conclusions one can draw from the perceptual map:
- Attributes such as Shiny & Lustrous, Soft, Beautiful, Healthy Scalp, all of which are close to the origin, are generic in nature.
- Attributes like Hair Expert, Strengthens Hair, Prevents Dandruff, Frequent Use and VFM are more important in distinguishing one brand from another, in people’s minds.
- Pantene is centrally located. Usually, this is not a desirable position. However, considering that Pantene is the market leader, and that it comes with a number of variants, it has the capacity to appeal to consumers from different segments.
- On the other hand, a central position is undesirable for a relatively small brand like Optima. To survive, a small or medium size brand should be well differentiated, so that it occupies a profitable niche or segment.
- J&J, Timotei, Rejoice and Sifone compete in the same space.
- Organics is uniquely positioned as a brand that strengthens hair and nourishes roots.
Note that the attributes used in this shampoo example pertain primarily to functional, rational aspects such as makes hair shiny, prevents dandruff, strengthens roots; and that there is less use in the example of emotive, personality, or brand-consumer relationship benefits. The choice of attributes, as mentioned, is primarily dependent on the purpose and objectives of the study. Since Organics offers functional benefits, the brand’s manager wants to assess the brand’s image along functional attributes.
If, on the other hand, a marketer is seeking to understand the personality of a brand targeting a demographic profile such as young women, through personality and relationship traits, the attributes the marketer might consider using would pertain to emotive, personality and brand-consumer relationship benefits.
Previous Next
Use the Search Bar to find content on MarketingMind.


Contact | Privacy Statement | Disclaimer: Opinions and views expressed on www.ashokcharan.com are the author’s personal views, and do not represent the official views of the National University of Singapore (NUS) or the NUS Business School | © Copyright 2013-2026 www.ashokcharan.com. All Rights Reserved.