
-
Segmentation
Schizophrenic Consumers
Need States
Segmentation Methods
A Priori Segmentation
Post hoc Segmentation
Segmentation Analysis
Targeting
- Segmentation
- Qualitative Research
- Quantitative Research
- Customer Satisfaction and Customer Value
- Consumer Panels and Consumer Analytics
- Big Data and Consumer Analytics
- Marketing Education
- Is Marketing Education Fluffy and Weak?
- How to Choose the Right Marketing Simulator
- Self-Learners: Experiential Learning to Adapt to the New Age of Marketing
- Negotiation Skills Training for Retailers, Marketers, Trade Marketers and Category Managers
- Simulators becoming essential Training Platforms
- What they SHOULD TEACH at Business Schools
- Experiential Learning through Marketing Simulators
-
MarketingMind
Segmentation
Schizophrenic Consumers
Need States
Segmentation Methods
A Priori Segmentation
Post hoc Segmentation
Segmentation Analysis
Targeting
- Segmentation
- Qualitative Research
- Quantitative Research
- Customer Satisfaction and Customer Value
- Consumer Panels and Consumer Analytics
- Big Data and Consumer Analytics
- Marketing Education
- Is Marketing Education Fluffy and Weak?
- How to Choose the Right Marketing Simulator
- Self-Learners: Experiential Learning to Adapt to the New Age of Marketing
- Negotiation Skills Training for Retailers, Marketers, Trade Marketers and Category Managers
- Simulators becoming essential Training Platforms
- What they SHOULD TEACH at Business Schools
- Experiential Learning through Marketing Simulators
Segmentation Analysis
Segmentation analysis is a four-phase process:
- Exploratory attitudinal research (qualitative research): To capture the key basis variables — i.e., the needs, benefits, perceptions and attitudes — that influence brand choice.
- Data collection: From a sample of respondents, obtain responses on basis and descriptor variables.
- Segmentation: Segment the market using the basis variables identified in Phase 1.
- Profiling: Profile the segments using descriptor variables.
Phase 1 — Exploratory attitudinal research
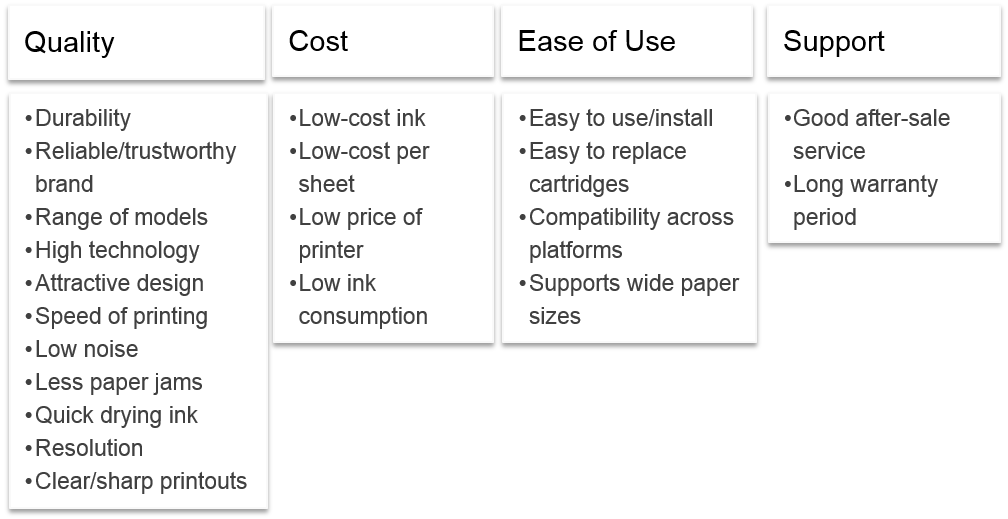
The exploratory attitudinal research phase uses focus group discussions, sometimes in combination with physical observation, to capture the basis variables that distinguish one consumer from another. The information from this phase reveals the habits, decision rules and preferences of consumers, and the functional and emotional aspects (product attributes) of the product that drive product or service choice. Exhibit 3.4 depicts an example from an inkjet printer market where 21 attributes have been identified as the basis variables.
Phase 2 — Data collection
The remainder of the segmentation analysis is quantitative in nature. In the data collection phase, information is obtained from respondents on the descriptor and basis variables. Questions on needs are framed in the form of agree-disagree or importance rating scales.
Phase 3 — Segmentation
Segmentation involves the following steps:
- Pre-segmentation processing: Factor analysis is conducted to condense the data to a smaller set of independent dimensions called factors.
- Forming Segments: Cluster analysis is used to form segments.
The basis variables usually comprise of groups of variables that are similar or interrelated (correlated). This can cause instability during the formation of clusters. It is therefore important to reduce these correlated variables to a smaller set of unobservable independent dimensions called factors. The statistical technique used for this purpose is called factor analysis. The data is analysed and represented in a manner such that those variables that are highly correlated (i.e., fluctuate together) are grouped into the same factor and those that exhibit low or zero correlation with each other, fall into different factors. The derived factors represent the original data more concisely, and usually yield more reliable clusters (segments).
For example, in Exhibit 3.4, the 21 product attributes are reduced to 4 factors. Variables low-cost ink, low-cost per sheet, low price of printer and low ink consumption are attributes that are interrelated and have been grouped under a factor that has been named “cost” by the researcher.
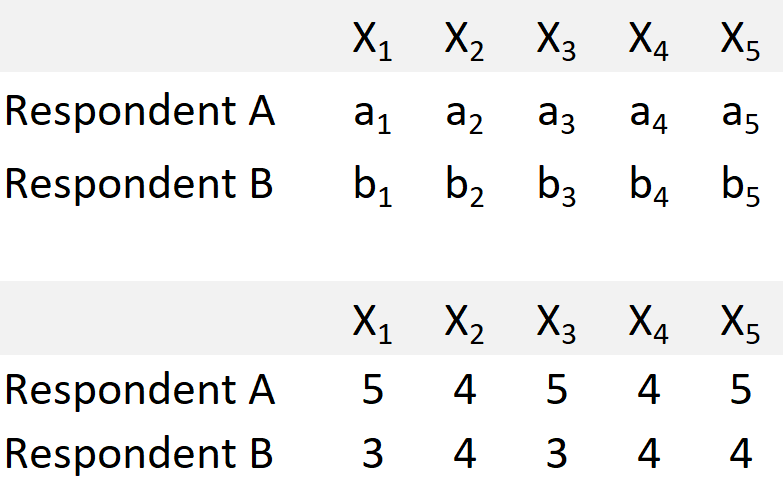
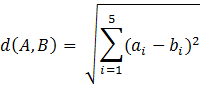
Cluster analysis groups together respondents with similar factor scores into clusters (segments). The basis for clustering of respondents for metric data (e.g., rating scales) is the Euclidean distance (or the squared Euclidean distance). In the context of a multidimensional space this is the actual distance between two points and is computed as the square root of the sum of the squares of the differences between the corresponding coordinates. In case of the below data pertaining to respondents A and B, across factors X1 to X5, the Euclidean distance is equal to 3:

Euclidean distances are computed across each pair of respondents, and the resulting distance matrix is used for forming the segments.
Among the wide range of techniques that are used for clustering data, K-means is one that is often recommended. It employs an iterative process to partition the respondents into a pre-specified number of clusters, in such a manner that the Euclidean distance between members within the same clusters is minimized.
An emerging technique, latent class clustering is increasingly recommended by a number of market research companies. Present day personal computers have the power to run these resource intensive methods which offer many advantages, including greater flexibility in use of different data formats (nominal, ordinal, continuous) and scaling of variables. They do however require larger samples.
For a detailed description of cluster analysis refer to Hair et al. (2009) or any similar text on multivariate data analysis.
Once the segments are formed, they need to be evaluated on the following criteria:
- Heterogeneous: Are there clear differences between the segments? Do they differ in their response to the marketing mix? Do they merit a distinct market strategy, different tactics?
- Substantial: Are the segments large enough in value and profit terms to warrant marketing and product development effort?
- Robust: Can the clusters be generalized to the market as a whole? One approach of assessing the stability of the segments is to split the data at random and cross-validate the solutions.
- Accessible: Is it feasible to reach the segments through appropriate media and product offerings?
Phase 4 — Profiling
In this phase the segmentation is rolled out to the entire customer base. The profile of each segment is created using all relevant variables including the basis variables used for the clustering as well as the descriptor variables.
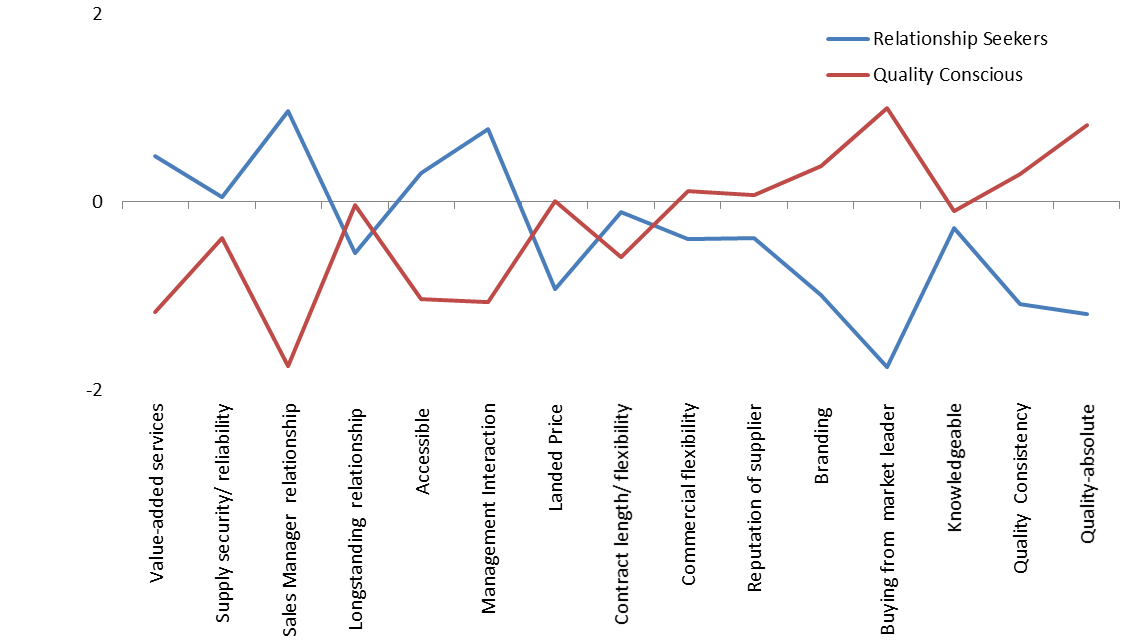
There are a few different ways to depict segment profiles. The average standardized scores may be reported as shown in Exhibit 3.5, an example from a B2B market. The plot reveals substantial differences between the two segments — relationship seekers and quality seekers.
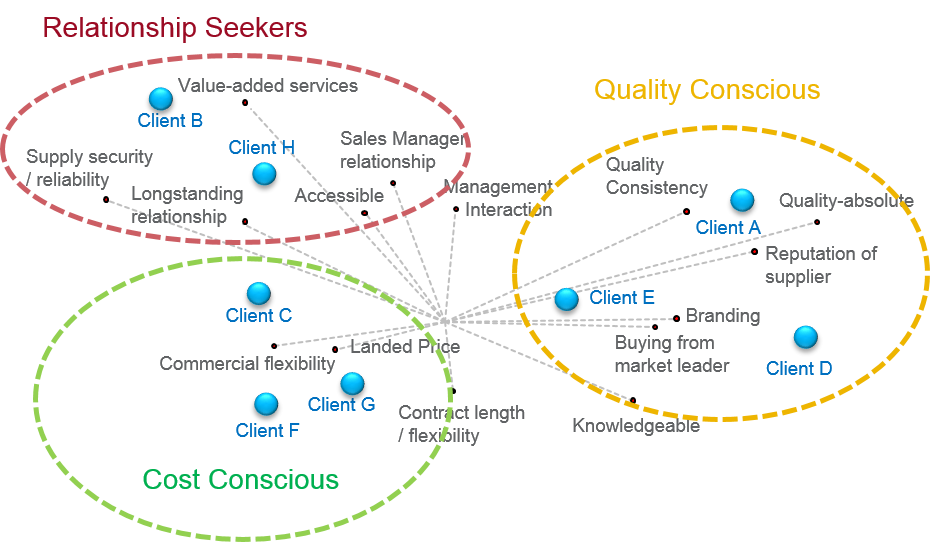
Exhibit 3.6 Perceptual map revealing opportunity areas, and associations between companies, segments and attributes.
The profiles may also be depicted perceptually as shown in Exhibit 3.6 which reveals opportunity areas, and associations between companies, segments and attributes.
To classify customers, we rely on a statistical technique called discriminant analysis. This technique identifies a set of variables that significantly differentiate each cluster and is used to place customers into segments.
The segment size can be estimated based on claimed purchases by the respondents.
Previous Next
Use the Search Bar to find content on MarketingMind.


Contact | Privacy Statement | Disclaimer: Opinions and views expressed on www.ashokcharan.com are the author’s personal views, and do not represent the official views of the National University of Singapore (NUS) or the NUS Business School | © Copyright 2013-2026 www.ashokcharan.com. All Rights Reserved.